
Ichimoku Cloud Strategy - Part 2
Royal Algo Ichimoku Cloud Strategy
Since you have an insight on how to use the Ichimoku Cloud Moving Average along with Royal Algo. We will keep this section short and precise. This is mainly an explanation of what the cloud is for.
How to Properly Set up your chart with Ichimoku Cloud
Now that you already have the Moving Average on your screen. You only need to enable the Kumo Cloud. Simply go to Ichimoku Cloud settings and then enable the cloud. For the Inputs, leave it as default.
You can change the opacity percentage to make the cloud more visible.
The process is similar for mobile. Simply click Ichimoku Cloud and then click the settings icon.

Recommendation - Do this!
We recommend that you go through this strategy section with Royal Algo and Ichimoku Cloud chart in front of you. So you can follow along and get familiarized with this strategy on your chart.
Chikou Span - Optional
For this strategy, chikou span will be optional.
Chikou Span - This line is also known as the lagging line. Mainly used for confirmation signals. Chikou Span is basically the current price that has been moved 26-periods back in time.
If you wish to add the Chikou Span. Consider these terms
Chikou Span indicates the evolution of the current price in relation to previous price action.
- When Chikou Span is above the current market price, this indicates that the current prices are higher than the previous prices, this suggests a bullish trend
- When Chikou Span is below the current market price, this indicates that the current prices are lower than the previous prices, this suggests a bearish trend
- When the Chikou Span is near or inside the current price, this indicates a ranging market
Many traders watch for the Chikou span to cross above or below with previous prices to signal a potential trend change.
How to read the cloud
Kumo or the cloud represents dynamic support and resistance level. The longer the price stays below/above the cloud, the stronger the trend is
- When the cloud is wide, the support or resistance level is strong. Meaning that the price breakout massively.
- When the cloud is thin, the support or resistance level is considered weak.
YOU SHOULD NEVER TRADE INSIDE THE CLOUD. THIS IS WHERE SUPPORT AND RESISTANCE MEET OR SIMPLY WHAT WE CALL THE RANGING MARKET.
How to read Ichimoku Cloud Trading Signals
Since we are already implementing the previous strategy. We will only use the cloud as another form of confirmation whether it is a strong signal or a weak signal.
- When the fast-moving Conversion Line crosses above the Slow-moving Baseline, below the Cloud, it is considered a weak buy signal.
- When the fast-moving Conversion Line crosses above the Slow-moving Baseline, above the Cloud, it is considered a strong buy signal.
- When the fast-moving Conversion Line crosses below the Slow-moving Baseline, above the Cloud, it is considered a weak sell signal.
- When the fast-moving Conversion Line crosses below the Slow-moving Baseline, below the Cloud, it is considered a strong sell signal.
Chart Examples
Strong Bullish Signal - When the fast-moving Conversion line crosses above the slower moving Baseline, above the cloud we have a strong buy signal. (When the Blue line crosses above the Red line, above the cloud we have a strong buy signal).

Weak Bullish Signal - When the fast-moving Conversion line crosses above the slower moving Baseline, below the cloud we have a weak buy signal. (When the Blue line crosses above the Red line, below the cloud we have a weak buy signal).

Strong Bearish Signal - When the fast-moving Conversion line crosses below the slower moving Baseline, below the cloud we have a strong sell signal. (When the Blue line crosses below the Red line, below the cloud we have a strong sell signal). There are two crossovers in this example.

Weak Bearish Signal - When the fast-moving Conversion line crosses below the slower moving Baseline, above the cloud we have a weak sell signal. (When the Blue line crosses below the Red line, above the cloud we have a weak sell signal).

Where to Place Your Stop Loss
We learned where to place our stop loss on the previous section.
- First, where the Baseline forms a horizontal line(low risk)
- Second, count 10-20 Pips below or above the buy/sell signal(medium-high risk) Of course this depends on what timeframe you’re trading on.
We recommend using the Baseline for stop loss. Red dotted line shows the stop loss level. This strategy is low risk. However, since the stop loss level is quite close to the entry. You may get stopped out too early, we suggest moving your stop loss according to your risk tolerance.

When Should You Enter a Trade?
From the previous section. We should consider not taking any position when the market is ranging. Another way to tell when the market is ranging is when the moving averages are pointing sideways. When you get a signal above or below the moving average while pointing upwards or downwards you may consider opening a position.
Now, you can use the cloud as another form of confirmation. Only consider taking Buy signals above the cloud and only Sell signals below the cloud. Never trade inside the cloud.
Tip: Also, you want to see the price consistently trending above or below the conversion line/blue line.
When Should You Consider Closing a Position?
From the previous section, we mention that there are several ways to close a trade on this strategy. First, when it seems like the Moving Averages are starting to point sideways and clasping each other indicating that the market is consolidating and can possibly go both ways. Second, when the opposing signal shows up. This depends on the current condition. Finally, when the opposite Moving Average crossover takes place. Meaning that the market is about to head in the opposite direction.
Now, we will add this condition. For higher risk tolerance, you must close your position as soon as the price touches the cloud. As we said, you should never trade inside the cloud.
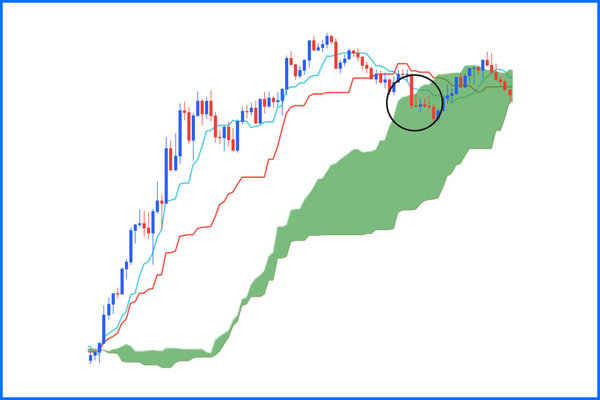
Market Example
This is an example of an Ichimoku Cloud set up. Any long/buy signal on this picture will be considered as a false signal. The first Sell signal happens before the crossover and it’s still above the cloud. In this case, we should wait for the candle to move below the cloud before considering taking the Sell signal.
The second Sell signal represents a strong downward momentum. Since the price is below the Conversion Line and the Baseline. At the same time, the Moving Average crossover already took place. Additionally, the trend is currently below the Kumo cloud indicating a bearish movement.
If you plan to use this strategy, we highly recommend to wait for all of these confirmation and conditions to be met. Which is the crossing over of the moving averages, sell signal, and the price must be below the cloud for a higher chance of winning.
Red dotted line shows the stop loss level. This strategy is low risk. However, since the stop loss level is quite close to the entry. You may get stopped out too early, we suggest moving your stop loss according to your risk tolerance. But in most cases, if it's a good trend the stop loss at the baseline is reasonable.

Key Take-Aways
The Ichimoku Cloud system has certainly improved our trading strategy. Being that it offers dynamic support and resistance, and the ability to predict price movement.
Trading using Ichimoku Cloud is simple but not easy. The main goal of this strategy section is to show you how we execute Royal Algo indicator along with the Ichimoku Cloud system. There are a lot of valuable YouTube videos out there that go in-depth on how to use the Ichimoku Cloud Indicator. You should definitely check those out, as it will improve your ability to read the indicator a lot better.
If you need any assistance or have any questions, please reach out to us via email on our website under the contact us section or the email down below. Royal Algo offers 24/7 support. But due to high traffic, it may take a few hours for our support team to respond. We will do our best to get back to you in a timely manner.
Copyright © 2022 Royal Algo. All rights reserved.